Understanding Fibonacci Retracement
Fibonacci retracement is a popular technical analysis tool used by traders to identify potential levels of support and resistance in a market. It is based on the Fibonacci sequence, a series of numbers where each number is the sum of the two preceding ones. Traders use these levels to predict potential price reversals or corrections in a market trend.
How to Use Fibonacci Retracement
Identify a Trend
The first step in using Fibonacci retracement is to identify a trend in the market. This can be done by analyzing the price movements over a certain period of time and determining whether the market is moving up or down.
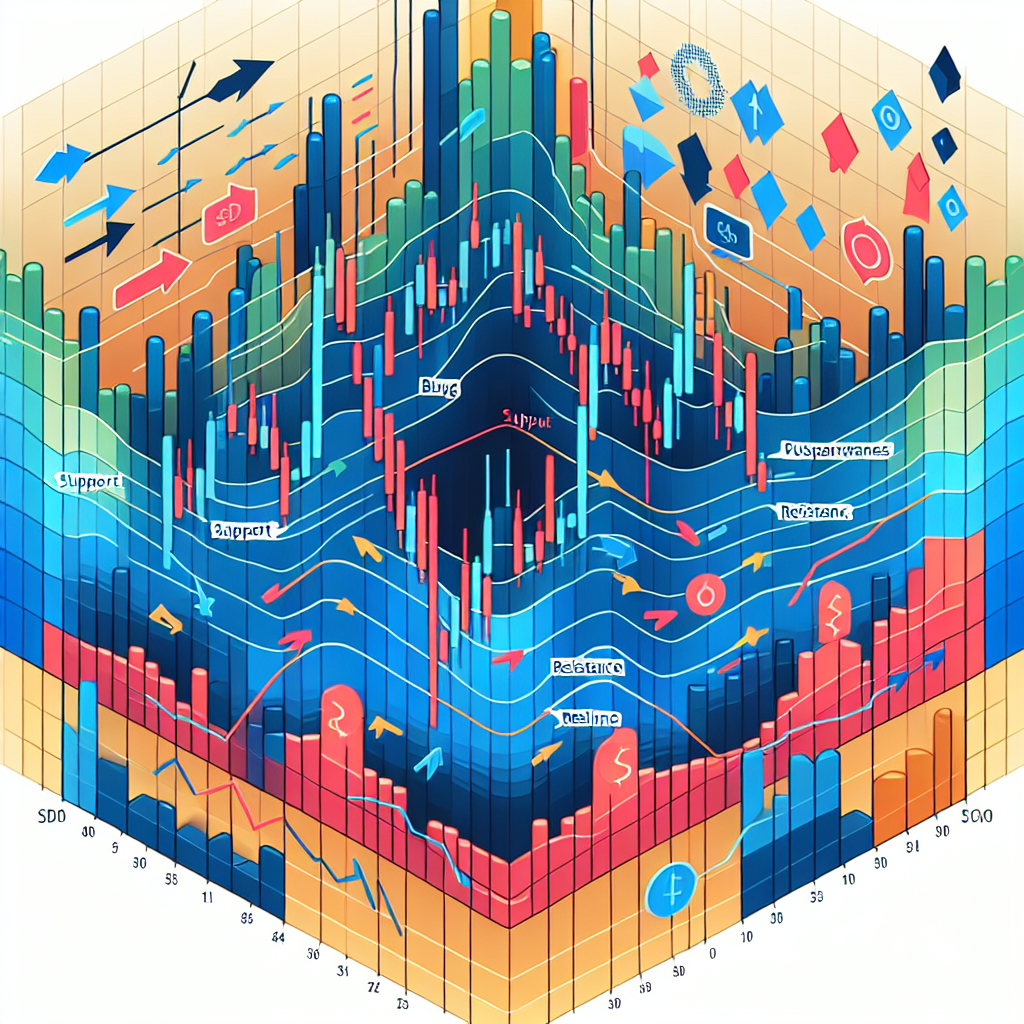
Draw Fibonacci Levels
Once the trend is identified, traders can draw Fibonacci retracement levels on a chart. These levels are drawn by connecting a significant low to a significant high in an uptrend, or a significant high to a significant low in a downtrend. The key Fibonacci levels are 23.6%, 38.2%, 50%, 61.8%, and 100%.
Identify Potential Reversal Points
Traders use Fibonacci retracement levels to identify potential reversal points in a market trend. These levels act as support and resistance levels, where price may reverse or consolidate before continuing in the original direction.
Use Other Indicators
While Fibonacci retracement can be a powerful tool on its own, traders often use it in conjunction with other technical indicators to confirm potential reversal points. This can include moving averages, trendlines, and oscillators.
Applications of Fibonacci Retracement
Entry and Exit Points
Traders use Fibonacci retracement levels to determine entry and exit points in a trade. They may enter a trade at a Fibonacci support level in an uptrend, or at a Fibonacci resistance level in a downtrend. Similarly, they may exit a trade at a Fibonacci resistance level in an uptrend, or at a Fibonacci support level in a downtrend.
Stop Loss Placement
Fibonacci retracement levels can also be used to place stop-loss orders in a trade. Traders may place a stop-loss order just below a Fibonacci support level in an uptrend, or just above a Fibonacci resistance level in a downtrend to limit potential losses.
Profit Targets
Traders can use Fibonacci retracement levels to set profit targets in a trade. They may take profits at a Fibonacci resistance level in an uptrend, or at a Fibonacci support level in a downtrend to lock in gains.
Conclusion
Fibonacci retracement is a powerful tool that can help traders identify potential levels of support and resistance in a market. By understanding how to use Fibonacci retracement and applying it to their trading strategies, traders can improve their chances of success in the market.